
CORE WEB VITALS

Your site is slow. We find out why and remove it.

The average website takes about 15 seconds to load on a phone. Every second you shave off is revenue, ranking, and a customer who doesn't bounce. We measure the real numbers and fix the code that's causing them.

  • <2starget load time
  • 100Lighthouse goal
  • 3Core Web Vitals metrics
PageSpeed Insights dashboard showing a site going from a failing score to a perfect Core Web Vitals result
THE THREE NUMBERS THAT MATTER

What Google actually measures — and what "good" looks like

Core Web Vitals are three specific metrics. They are not a score you can fake with a plugin; they are measurements of what a real user experiences on a real connection.

LCP

Largest Contentful Paint

How long it takes for the biggest visible element — usually your hero image or headline — to render. This is the number a customer feels as "the page finally loaded."

Good: under 2.5 seconds Most sites we audit are well past 5 seconds on mobile.
INP

Interaction to Next Paint

How quickly the page responds when someone taps, clicks, or types. A slow INP is what makes a site feel frozen — the tap registers, nothing happens, then everything jumps at once.

Good: under 200 milliseconds Heavy JavaScript is the usual cause.
CLS

Cumulative Layout Shift

How much the page jumps around while it loads. You go to tap a button, an ad loads above it, and you tap the wrong thing. Layout shift is a trust problem, not just a metric.

Good: under 0.1 Usually caused by images without dimensions and late-loading embeds.
THE GECKO BULLETIN

Weekly teardown: a real website, everything broken in it, and exactly how we'd fix it

HOW WE MEASURE

Real devices, real connections — not just a lab score

Lab scores are useful. Field data is the truth. We look at both, and we test the same way your customers actually use your site.

Throttled Mobile Testing Your site on a mid-range phone over a realistic 4G connection — where most of your traffic actually is.
Field Data from Real Users CrUX data and your own analytics, so we see what your visitors experience, not just what a lab run shows.
Resource Waterfall Analysis Every script, stylesheet, font, and image, ranked by how much it costs you in load time.
Third-Party Script Audit Chat widgets, analytics, tag managers, and marketing scripts — the biggest hidden cost on most sites.
Image & Font Optimization Actual file sizes, formats, and loading strategy. Most sites ship images at 5–10× the size they need.
Render-Blocking Analysis What's stopping the browser from painting your content, and in what order.
Before & After Captures Every optimization is recorded with a timestamped before/after so you can see the change, not just trust it.
Cross-Browser Verification Tested on Chrome, Safari, Firefox, and Edge — because "it's fast in my browser" is not a measurement.
WHAT CHANGES

When your site is actually fast, this is what you get

✓ Sub-2-second loads on real mobile connections
✓ A 100 Lighthouse performance score
✓ Core Web Vitals that pass in the field, not just the lab
✓ Lower bounce and higher conversion from the same traffic
✓ Better search rankings — speed is a ranking signal
✓ No third-party script roulette slowing you down

Speed and accessibility share the same root cause: bloat. Fix the bloat and both improve at once.

Rebuilt website showing perfect Lighthouse scores for performance and accessibility
Developer inspecting a resource waterfall to find what is blocking page render
WHERE THE TIME GOES

It's almost never the code you wrote. It's what got piled on top.

  • Page builders — A single Divi or Elementor page can ship 2–3 MB of CSS and JavaScript to render what should be 30 KB of HTML.
  • Plugin stacks — Forty plugins mean forty separate developers loading their own scripts on every page load.
  • Unoptimized images — A hero image exported as a 4 MB JPEG, served to a phone that needs 120 KB.
  • Third-party scripts — Chat widgets, heat maps, A/B tools, and tag managers that each block rendering for a few hundred milliseconds.
  • Font files — Whole font families loaded to render one heading, in a format no modern browser needs.
  • Layout shift from ads and embeds — Elements that load without reserved space, so the page jumps and users tap the wrong thing.

None of this is inevitable. It is a choice made by the tools you were sold. We make a different one.

See our build standard →
WHY THIS MATTERS FOR ACCESSIBILITY

Slow sites are inaccessible sites — for everyone, but especially for disabled users

Performance and accessibility are not two separate projects. They are two symptoms of the same underlying problem: too much code doing too little. Fix the code and both improve together.

What improves together

  • Less JavaScript means fewer places for keyboard traps to hide
  • Semantic HTML loads faster and reads correctly to screen readers
  • Real image dimensions prevent layout shift and improve the experience for magnifier users
  • Fewer third-party scripts means fewer surprises for assistive technology
  • Faster responses mean users of switch access and voice control complete tasks without timing out

What makes both worse

  • Overlay widgets add JavaScript and rarely fix the underlying issue
  • Page builders ship enormous CSS frameworks to style a handful of components
  • Plugin stacks load scripts on every page, whether or not they are used
  • Tag managers inject scripts you cannot see or control
  • Fixing one symptom without the other usually makes both worse
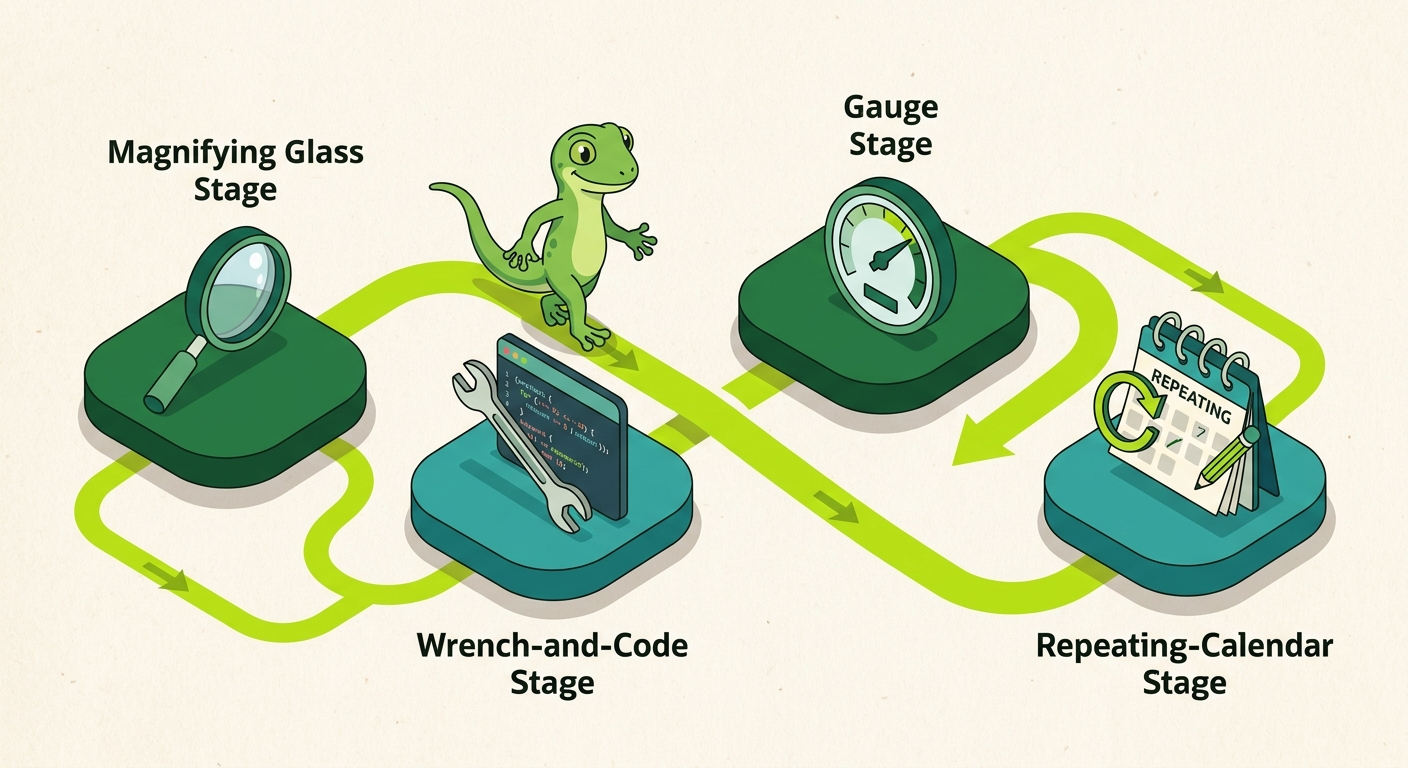
HOW PERFORMANCE WORK RUNS

From slow to sub-2-seconds in five steps

Measure

Field data, lab data, and a full resource waterfall. We establish the real baseline before touching anything.

Rank the cost

Every script, font, image, and query gets a cost in milliseconds. We fix the expensive things first.

Remove and rewrite

We delete what isn't earning its weight and rewrite what is, by hand. No new dependencies added.

Re-measure

Same tests, same throttled connection. If the numbers didn't move, we go back to step three.

Document

Before/after captures, cost savings, and a written log — the same documentation you get from an accessibility audit.

COMMON QUESTIONS

Questions about performance work

Can't I just install a caching plugin?

Caching helps, but it only hides the problem. If your pages are 4 MB of bloated HTML, caching serves 4 MB faster — it doesn't make the page smaller. We fix the weight, not just the delivery.

Will performance work break my design?

No. In most cases the fastest version of a page looks identical to the slowest one — the difference is what's loading behind it. We keep your design and remove everything that isn't earning its place.

Do I need a rebuild or can you fix my current site?

It depends on what's slowing you down. If the platform itself is the problem — a page builder that ships a megabyte of CSS to render a heading — remediation only goes so far, and a rebuild is the honest answer. The audit will say which one you actually need.

What is a realistic target?

Sub-2-second loads on a throttled mobile connection, and a 100 Lighthouse performance score. That's the standard we build to. If your site can hit it without a rebuild, we'll tell you. If it can't, we'll tell you that too.

Is a perfect Lighthouse score the goal?

No — the goal is a fast site for real users. Lighthouse is a lab tool; it's useful for catching regressions, but a 100 in the lab doesn't mean your field data is good. We chase the field numbers.

Does performance work also improve accessibility?

Often, yes. Removing heavy JavaScript, using semantic HTML, and setting real image dimensions all improve both at once. That's why we treat them as one project, not two.

How do you stop the site getting slow again?

Ongoing vigilance. We re-measure your Core Web Vitals on a regular schedule, so a new plugin, chat widget, or marketing tag gets caught before it becomes a problem. That monthly record is also useful documentation.

READY TO SEE WHAT'S SLOW?

Stop guessing.
Get your website audited.

We've checked over 1,000 websites and documented the failures on video. Get a written audit showing exactly what's slow on yours — and a plan to fix it right.

Get Your Accessibility Audit

A fast site is an accessible site — and both are better salespeople.
Written audit report showing a before-and-after Core Web Vitals comparison